Project Overview:
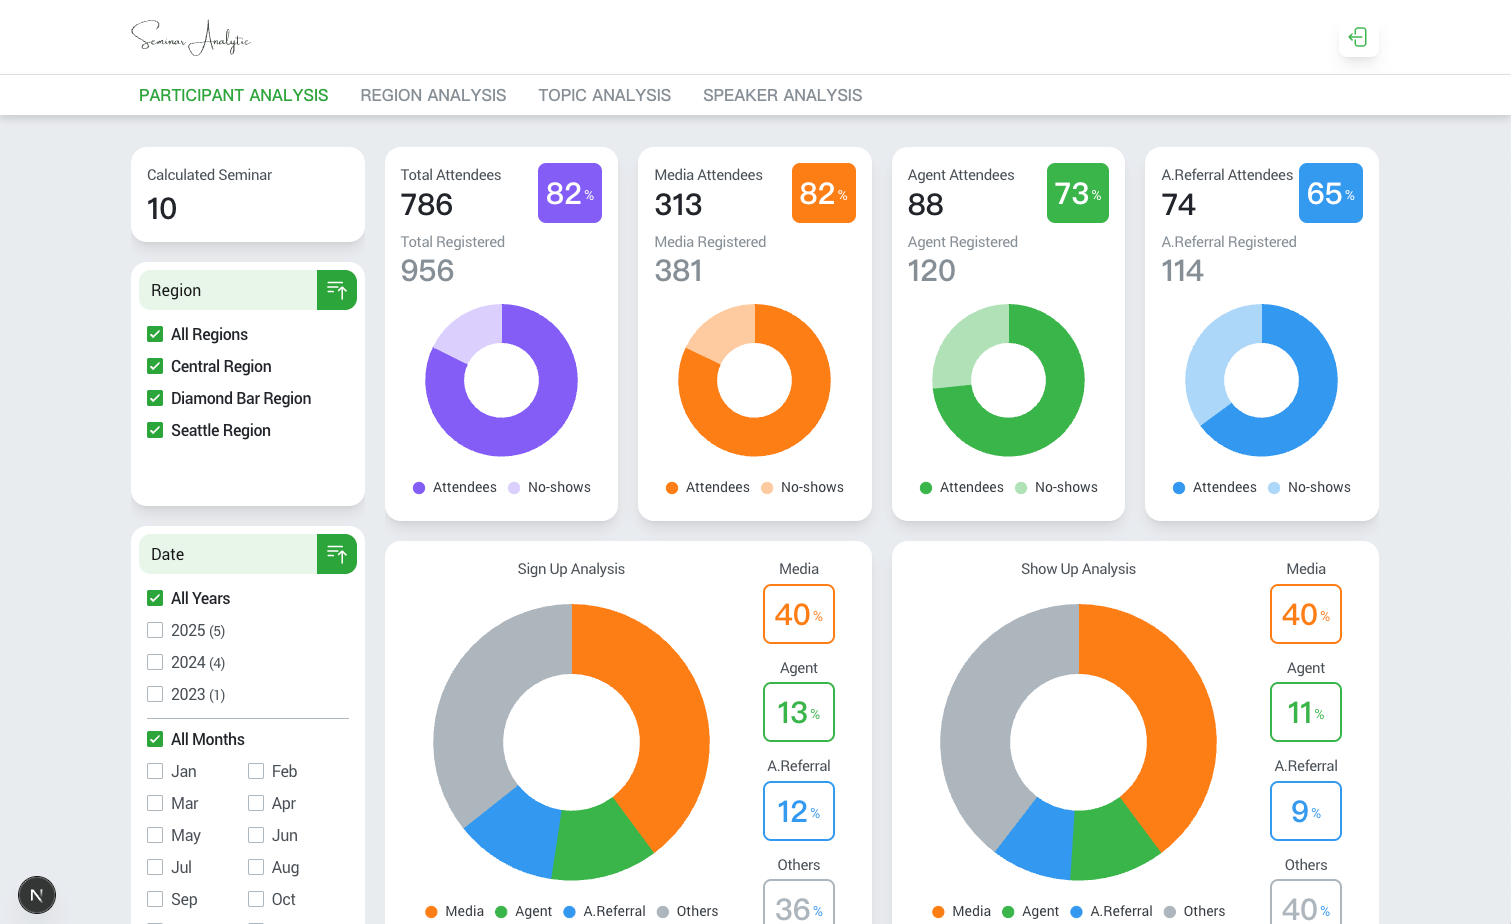
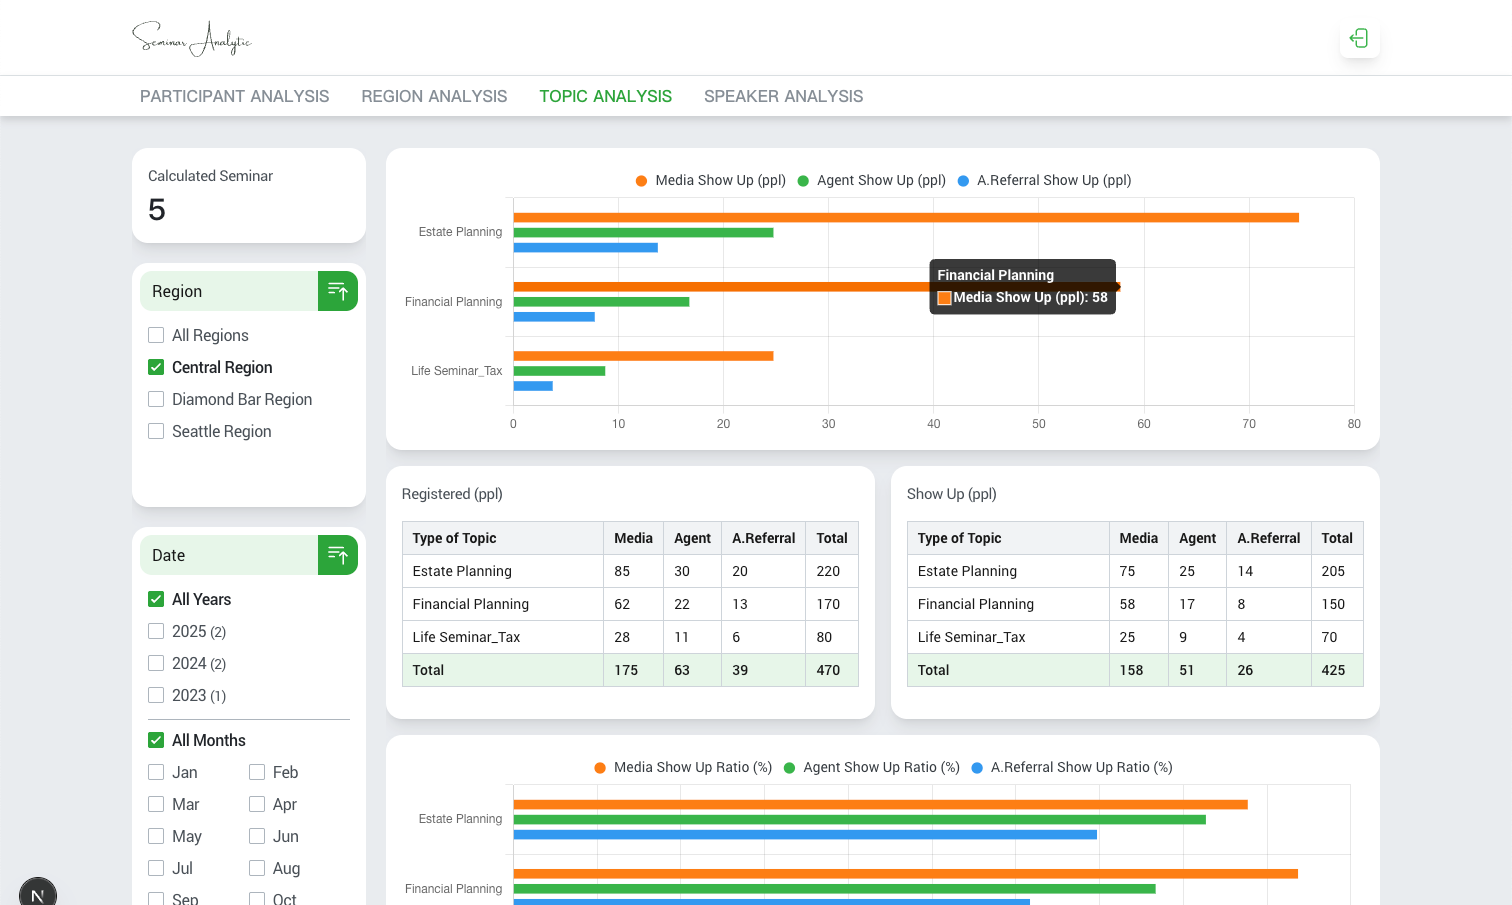
Developed a data-driven seminar analytics dashboard that visualizes attendance performance across regions, topics, and speakers. The system retrieves seminar records from HubSpot via API and displays them through interactive charts and filterable views.
This portfolio version uses mock data for demonstration.
(GitHub Code)
This portfolio version uses mock data for demonstration.
(GitHub Code)
Responsibilities:
.Designed the entire UI/UX layout, including chart displays, filtering panels, and tab-based navigation.
.Implemented four analytical modules: Participant, Region, Topic, and Speaker analysis.
.Developed interactive filtering logic for Region, Office, Date (Year/Month), Topic, and Speaker.
.Integrated HubSpot API workflows (mocked for portfolio) and structured data for visualization.
.Built responsive front-end architecture for seamless use across desktop and mobile devices.
Technologies Used:
Next.js, React, Tailwind CSS, Chart.js, react-chartjs-2, Axios, HubSpot API
_____________
專案概述:
開發一套以數據為核心的講座分析儀表板,用於視覺化不同區域、主題與講者的出席表現。系統透過 HubSpot API 擷取講座記錄,並以互動式圖表與可篩選介面呈現分析結果。
本作品集展示版本使用假資料進行示範。
開發一套以數據為核心的講座分析儀表板,用於視覺化不同區域、主題與講者的出席表現。系統透過 HubSpot API 擷取講座記錄,並以互動式圖表與可篩選介面呈現分析結果。
本作品集展示版本使用假資料進行示範。
工作內容:
.設計完整的 UI/UX 版面,包括圖表呈現、篩選面板與分頁式導覽。
.實作四大分析模組:參與者分析、區域分析、主題分析與講者分析。
.開發互動式篩選功能,支援依區域、辦公室、日期(年/月)、主題與講者進行篩選。
.整合 HubSpot API(作品集版本採用 mock data),並建立資料結構以供圖表視覺化使用。
.打造響應式前端架構,確保在桌機與行動裝置上皆能順暢使用。
使用技術:
Next.js、React、Tailwind CSS、Chart.js、react-chartjs-2、Axios、HubSpot API